Testimony: the development of my beliefs
posted on 2012-06-29
In February 2011 I was discharged as a conscientious objector after 7 years in the Navy. Part of the conscientious objector process is an interview with an investigating officer. His job is to assess the “depth and sincerity” of the applicant’s beliefs. The interview spanned three days and covered both technical legal points and broad theological concepts. Here is a longish excerpt where we talk about the development of my beliefs as a conscientious objector.
The investigating officer is in bold, and I am in plain text.
The criteria for a “conscientious objector” discharge is that you’re opposed to participation in war in any form, that opposition is based on religious training or belief, that your position is firm, fixed, sincere, and deeply held. All four of those. The burden of proof is on you. You must establish clear and convincing evidence. This is different than a regular court, where if someone accused you of something they would have to prove that you did the wrong. In your case, you’ve come to the hearing, and you have to prove your case.
Your legal counsel will be in here the entire time. I have your petition right here, and I’m going to ask you questions about it so that I can understand your beliefs. Afterward, I’m going to make a summary, and I’ll try to get my report completed as quickly as possible after the hearing and get the stuff to your captain.
Right, I understand.
Okay, let’s begin.
You joined the navy in 2004 right after high school. The invasion of Iraq had just begun. In your application on page 5 you say, “I felt the call to serve my country. The United States was at war, and I firmly believed she needed my service.”
Based on your old religious studies you used to support war. Now based on recent religious studies, you have come to the opposite conclusion. What is your plan if a year from now, your beliefs once again change, and you’re no longer a pacifist?
First, I’d like to describe my beliefs while I was in high school. Like I said in my application I was raised as a nondenominational Christian. When I was very young we attended church regularly. Probably when I was about ten—I forget the exact date—we stopped attending. We’d go only on Christmas and Easter and major events like that. It was in high school when some of my school friends were attending Pacific Coast Church, so I decided to go with them. That was when religion started becoming important to me. I began attending church regularly and joined the youth group.
Those years were very much me trying to understand what those people at church believed and why. For example, they believed in service and sacrifice for a greater cause. That was very important to them and very important to me. That’s why I felt that I had to serve my country. And because I lived in a military community, service to the country meant joining the military. I think in a lot of communities that means the same thing.
But it wasn’t as a result of study. It was through a very different process than how I came to the convictions that I have now. Before I was trying to figure out what other people believed, and now I’m trying to make my life as close to Jesus’s as possible.
Was it more like riding the bus instead of driving the bus before?
No, I was very much involved. But, at that point the involvement was very corporate, and less personal. I recognized that the bible is a big book and Christianity is a big religion. It’s hard to understand it all. Theology is very complicated. Or at least we make it complicated for some reason.
I saw these people at church. They had looked at this stuff already, so to some extent I just trusted what they said. They have a sermon to preach, and I’m going to listen and see what they have to say. And their sermons were never everyone has to go and join the military. I don’t even remember any sermons about the military. I remember some of them had been in the military and that was probably related to some of their teachings, but that’s it. I think it was a pretty average nondenominational church.
Do you remember if they were teaching from the bible? Did they quote from the bible a lot?
Yes. They believed the bible was the word of God and that it has no errors.
And you grew up near the military?
We lived right next to Camp Pendleton, the biggest Marine Corps base on the west coast. From our backyard you could hear the practice bombs being dropped. So I had a lot of friends with military parents. In high school, my friends and I would go paint balling on the base and watch the military exercises.
I was only six at the time, but I remember our city throwing parades for the marines when they came back from Desert Storm. From then until high school, Colin Powell was my hero. I remember waiting in line for hours to meet him and tell him he should run for president.
Let’s see. You also wrote in your application that your grandparents had a big impact on your life, right?
Yes, sir. One was in the army and one in the navy. I grew up pretty close to my mom’s side of the family, and that was the grandad in the navy. He was at both Pearl Harbor and Midway. I did a history day project in middle school about him at Midway. It went all the way to the state competition. Sadly, he died a few years ago and I couldn’t go to his funeral because of navy obligations I had.
****I think my becoming a conscientious objector has been really hard on my granny. She’s very religious, like me, but I think she saw it as a betrayal of grandad. They were really proud of me for going to the Academy. I remember them coming out to all the events even though it was getting hard for them to travel. It was really hard for me to first tell her why I was trying to leave the navy, but I think she’s okay with it now.
So after high school, you went to the Naval Academy. In your application on page 6, you mention spending a week on a submarine for PROTRAMID. Quickly, what’s PROTRAMID?
PROTRAMID stands for professional training for midshipman. While I was at the Naval Academy, we would attend classes during the school year. The summer was broken up into 3 blocks, and each block we would have some sort of direct military assignment. The summer before my junior year I went on PROTRAMID. During that month long period we spent a week with the marines, a week with the aviation community, a week with the submarine community, and a week doing leadership development. And so it was the week with the submarine community.
But I did a lot more than just PROTRAMID during the summers. I spent a month on the Bon Homme Richard LHD-6, a “helicopter carrier.” I did an internship at the National Security Agency doing electronic warfare. And I did a lot of piloting patrol ships up and down the east coast. PROTRAMID was just the only time I spent on a submarine before graduating.
Edit: I have a note here saying that the investigating officer spilled coffee on himself. He makes a joke about how he likes to put in just enough creamer so it blends in with his khaki uniform when it spills. I was so nervous, and I remember this relieving a lot of the tension.
So tell me about your time on the submarine since that’s what you decided to go into.
The submarine was out of San Diego. I believe it was the Jefferson City. We only spent 2 days underway. During that time, they did the sorts of things they do for midshipmen, for example angles-and-dangles. It’s just maneuvers of the submarine to see that the floor is moving and that you’re almost walking on the wall at some points. The whole idea was to show us what life on a submarine would be like.
I think what appealed to me about submarines was really the sort of missions they go on. I really felt submarines were an important part of our national security policy. I felt like this was where I could have the most impact on the world, make the biggest difference. So that ultimately made me choose submarines. That and realizing they’re not as claustrophobic as I thought.
Edit: Some submarine missions are:
ISR (Intelligence, Surveillance, and Reconassaince): sticking high tech antennas up near foreign militaries to figure out what they’re doing
Strike warfare: launching tomahawk cruise missiles at targets that regular ships can’t reach
Special warfare: delivering Navy SEALs into foreign countries without being detected
Anti-submarine and anti-surface warfare: traditional WWII style killing each other
Nuclear deterrence
A really good book about the submarine force is Blind Man’s Bluff.
Oh Okay. Now when did you make that choice?
Either late junior year or early senior year. It was a fairly long process because of the interviews and stuff involved so I forget the exact date.
Edit: You have to pass a technical interview with a 4 star admiral—the guy in charge of the whole military nuclear program—to become a submarine officer.
Did you receive any bonus for choosing submarines?
I did. I received a nuclear bonus of fifteen thousand, I believe, and like I said in my application I am prepared to pay that back. Also, I’m prepared to payback all the education expenses for the Naval Academy. No one who I’ve talked to knows how much that’s going to be, but it doesn’t matter to me. I don’t care if I’m in debt for the rest of my life. It’s just money. I can’t sacrifice my conscience.
So still in your junior year you really weren’t a conscientious objector yet, right?
In no way, shape, or form.
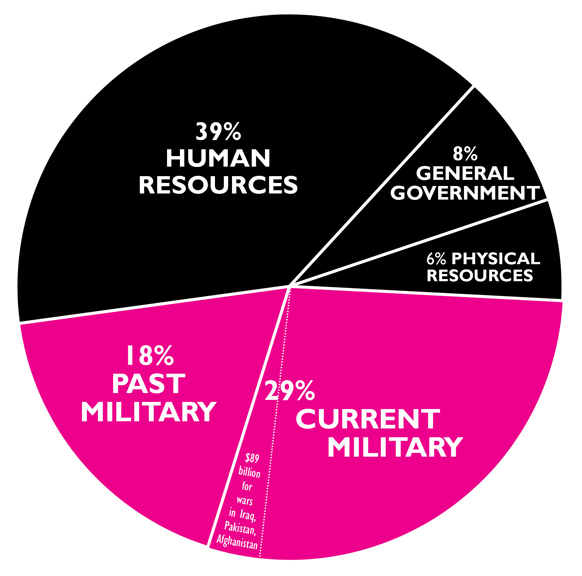
Okay. Let’s see. In your application on page 6, you said, “We calculated the extent of civilian casualties and whether these numbers were politically acceptable for different types of targets. I accepted that this is the way things were done.” What did you mean by politically acceptable?
In that context I was taking a naval weapons class at the Academy. The way the class was structured was, we as the operators of the weapons needed to be able to understand the politics of using those weapons and the strategy of using those weapons. The strategy was calculating the sorts of damage they would do, and the politics was deciding whether that damage was acceptable.
Acceptable to who?
People higher ranking than me. My job as junior officer is using the weapons; more senior officers do the strategy part; and very senior officers or civilian appointees write the rules of engagement or provide guidelines on in this circumstance it is politically acceptable and necessary for the United States to use these weapons. I understood that at the time to be necessary for our national defense and security and our freedom and democracy and things that I supported. So I supported that structure and supported my role in that structure.
Would it be appropriate to put a sailor or a soldier in charge of a weapon without the knowledge of the devastating effect of the weapon?
I’m personally glad that the Navy taught me about the weapons systems and how they worked and the effects that they will have before putting me in a role where I would be expected to use them.
Actually, one of the things that first got me started down this road is the idea that you should be able to do your boss’s job. I asked myself, “Okay, if I were the one making the decision on when and where to launch a missile, what would I decide?” I felt like a good officer should be able to answer that question, and I wanted to be a good officer.
Okay. On page 6 of your application, you talk about the sad state of people’s beliefs regarding the sanctity of human life. Then you state, “I believed it was my responsibility as a Christian to make my service conform to the ideals of the just war, and in doing so, bring others up to my standards.” So you would go off, be in the military, and that would be your ministry. Basically, to bring others up to Jesus’s standards I’m sure is what you meant.
** So that means at the time you believed that you should be in the Navy. Because what you had learned was that maybe a lot of people were not Christians out there that perhaps could come to know Jesus through your testimony.**
It wasn’t that I wanted to make people come to know Jesus through my testimony. It was that I saw specific things that were bad about the military and were not the military as the way I thought it should be. For example, there is too much killing of civilians. I watched marines brag about it, and I was appalled. The other communities were even worse. Pilots drop bombs from F-18’s, but all they care about is how fun it is to fly faster than the speed of sound. On the submarine, nothing matters except passing your ORS.
Edit: ORS stands for Operational Reactor Safeguards exam. It’s a routine inspection done to submarines to ensure the nuclear reactors are being operated correctly. If a submarine doesn’t pass, then it can’t go on its missions until it does, so all the other submarines have to do the missions instead and make fun of you.
I thought to myself, “This needs to stop, and I’m going to use my authority and example as an officer to make it stop.” So my goal wasn’t to convert people to Christianity, but to make the military a better institution. I wanted our military to live up to the ideals of just war theory. I used to believe in a just war, but I don’t anymore.
Your belief to go forth and bring others up to standard is actually supported by the following scripture. Mathew 9:9-12, “As Jesus went on from there, he saw a man named Mathew sitting at the tax collectors booth. Follow me he told him, and Mathew got up and followed him. While Jesus was having dinner at Mathew’s house, many tax collectors and sinners came and ate with him and his disciples. When the pharisees saw this, they asked his disciples, ‘Why does your teacher eat with tax collectors and sinners?’ On hearing this, Jesus said, ‘It is not the healthy who need a doctor but the sick.’” Mathew 28:18-20 says, “Then Jesus came to them and said, ‘all authority in heaven and on earth has been given to me. Therefore make disciples of all nations, baptizing them in the name of the father the son and the holy spirit, and teaching them to obey everything I have commanded you.’”
Why don’t you think you can do this anymore?
I don’t believe it’s possible to have a just war. I look at all the wars throughout history—especially the ones the US has been in—and all I see is economics and greed. War changes you. It makes you think there’s things more valuable than human life. Well I don’t believe that.
But what about wars like World War II where we fought to defend human life?
I struggled for a long time with this. I really like Bonhoeffer’s approach here. He was basically a pacifist until he tried to assassinate Hitler. His thinking was, “Lord, I know what I’m doing is wrong, but I just don’t see any other way. Please forgive me.” It’s people like that who are trying to live out the just war theory. I don’t see any of that in our military, so that’s the sort of thinking I wanted to bring.
The problem I see now is that a military man cannot think this way. War is not normal, but when you dedicate your life to the art of war it becomes normal. Even if you try to keep it from becoming normal, you can’t. When I was first learning to fire our 9mm, we used sillouettes of people as target practice. The whole point of that is to desensitize us to killing, so that it becomes normal and we get better at it. It’s even worse here in America. I can’t leave my house in uniform without people thanking me for my bravery and service. They thank me for killing people! So what I’m doing must be normal, right?! That’s what we start saying to ourselves.
So that’s why I don’t think the military can ever fight just wars, even in cases like WWII.
So you’d let Hitler take over the world?
No, sir. I see lots of inspiring stories about nonviolence. I see the conscientious objectors in America volunteered for medical experiments that helped save millions from starvation and disease at the end of the war. I see the Danish resistance movement which was largely nonviolent. I see the Rosenstrasse protest where Jews were given their freedom to live in Berlin throughout the whole war. I see the White Rose and the village of Le Chambon. And I see all the otherRighteous among the Nations. I see all these examples of nonviolence, and I’m inspired to follow them.
So I don’t know if these things would have worked on a larger scale, but I know they worked on a smaller scale. And my faith is in Jesus. That when I choose to follow him—really to follow him at the expense of everything else—I believe he makes miracles happen. I believe he changes hearts. And I am willing to suffer and die for this belief. If all we could do to fight evil was to wage war, then we should wage war. I used to think that’s all we could do. But now I believe Jesus shows us another way.
Finally, part of being a peacemaker means taking the plank out of our own eyes. We created Hitler. We created the economic misery Germans faced with the Treaty of Versailles. That was our desire for vengeance. Many Jews came and saught assylum here, but we turned them back and handed them to Hitler. We keep on creating enemies, then killing new enemies, then creating more in a vicious cycle. It’s the same thing we did with Bin Laden and Ahmadenijad. When you ask me to go in a submarine and kill some ragheads, you’re really asking me to create an enemy out of their children that my children are going to have to fight.
That stuff only worked because there were soldiers on the ground. If everyone thought that way, then there’d be no one left to actually fight evil.
Well, I think Jesus’s vision of peace is a lot harder to work for than the military’s vision of peace. Even though Chesterton wasn’t a pacifist, he said it best that “Christianity hasn’t been tried and found lacking, it’s been found hard and not tried.” I want to try it.
Okay. Let’s go back a second. Once again, first you thought you could help reform the military. This was while you were at the Academy and just after graduating. Only later did you become a conscientious objector?
Yes, it was while at the Academy, and I hadn’t had any thoughts about conscientious objection. I didn’t even know what it was.
When did you learn about conscientious objection?
About a year after graduating from the Academy. I was at nuclear power school, learning how to operate the reactors on the submarine, when I really began to struggle with this issue in my faith. I was flagged by a psychological screening as possibly unfit for duty, but after a few conversations with the psychologist he cleared me. But I still wasn’t comfortable, so I went to see the chaplain. We had a lot of conversations, and eventually he showed me MILPERSMAN 1900-020, the regulations for discharge as a conscientious objector. Like I said, I’d never heard of that before. He recommended I fill out the application as a way to clarify my beliefs, to see if this fit me. So I did.
That was in early 2009? Around March?
Yes, sir.
But you submitted your application in October?
****Well, it took me a long time to figure out this was what I had to do. It wasn’t a light decision for me, but something I really struggled with. I had to make sure it was right.
You’ve isolated yourself from other people in the Navy. Do you believe it is wrong to associate with people who don’t agree with your beliefs?
No. I do not believe that it’s wrong. In many ways I think it’s a healthy thing to do. I think an important part of growing in your faith is challenging it, so I’ve tried to talk to lots of people who disagree with me.
That’s actually how I first started thinking about pacifism. At the Naval Academy, we took a course on ethics. We talked about things like the just war tradition. But I was never satisfied with that discussion, because I didn’t feel like I had heard both sides of the issue. So I started reading about pacifism, and I learned that there were groups of Christians who were pacifist. I never knew that before. Growing up, no one ever told me that there’s pacifist Christians.
So when I first started reading about these guys, I did it to challenge my beliefs. I thought that it would make me a better naval officer, because then I would better understand why it is that I’m going to war. I kind of assumed these guys were naive and stupid, but I wanted to know why they were naive. It had the opposite effect. I read people like Yoder, Hauerwas, Dorthy Day, Martin Luther King, Walter Wink and Gandhi. I read a lot. And all of these people impressed me. Their theologies impressed me, but even more so their lives impressed me.
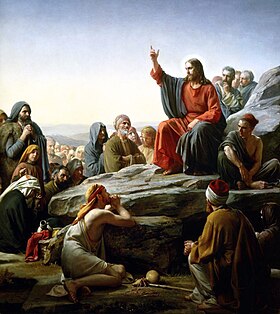
At the Academy we would occasionally read off medal of honor citations. I would think to myself, “These guys are heroes. What sacrifice! What effort to save their fellow soldiers!” But now I was reading these Christian pacifists and I see the same sacrifice and efforts. It amazed me because these pacifists were helping people at least as much as the medal of honor guys did, and they didn’t even have to kill people to do it. In fact, they were helping their enemies just as much as helping their friends. I’d never seen people with such a dedication to Jesus, and that’s what I wanted in my own life. This caused me to read the sermon on the mount over and over, and the more I read it the more I felt the call that Jesus wants us to be nonviolent.
This really disturbed me. I didn’t want these newly forming beliefs. These beliefs have totally ruined my life. I always wanted to be a military officer. I spent my whole life dreaming about it. I can’t even describe the conflict inside of me.
So I did everything I could to convince myself that these beliefs weren’t real. I talked to my closest navy friends about them. We had long conversations analyzing the justness of all the wars America’s ever been in. I talked to my pastors. Lots of pastors actually, I think probably more than 10 now. Both military and civilian, from every denomination possible. I talked to my parents and my family. All of these people believed in just war, and tried to convince me to stay in the navy. Like I said before, I wanted them to convince me. But they couldn’t. Now that I understood what Jesus’s love meant. That it meant loving your enemies, and forgiving them even as they nailed him to the cross. I had to dedicate myself to that. How could I not?
It sounds to me like you were looking for an excuse to become a pacifist and avoid your military obligations.
No, sir. That couldn’t be farther from the truth.
Pacifism isn’t the only part of my faith I challenged this way. I do it to every part of my faith. For example, I love reading books by Dawkins and Hitchens and all the other new atheists. I struggled with atheism for a while because of them. I didn’t know how to answer all their objections. But reading them really helped me focus my understanding of Christianity. They helped inspire me to study the historicity of the bible and to learn Hebrew. Ultimately, I was able to walk away with a stronger faith than I ever had before.
So I thought when I began reading the pacifist books the same thing would happen. Like I said I thought I would become a better officer. But the pacifists just made more sense. I saw Christ in their lives.
So why have you isolated yourself from the other people in the navy?
I haven’t been hanging out here with the other submariners because we don’t have much in common, and at the end of the day I just want to escape. The whole thing’s really frustrating for me. I’ve talked to so many people about these beliefs already. I don’t need these guys making fun of me—you know how submariners can be to outsiders—and making my life harder than it already is.
You’ve spent a lot of time since then learning to operate the nuclear power plant on a submarine. How has that affected you beliefs?
Not a lot. I think nuclear power can be a good thing, but not nuclear weapons. I’ve been training enlisted sailors for war, and that really bothers me. It’s pretty hard working 12 hours a day, 7 days a week, doing things I don’t believe in. This has really contributed to my stress and frustration with the whole situation.
You know that we don’t put people in charge of nuclear missiles who don’t want the responsibility.
Yes, sir, I know. But my beliefs aren’t just against nuclear missiles, they’re against all weapons and all warfare.
When you launched torpedoes in the trainer, why didn’t you just stand up and tell them it’s wrong and they need to stop? Why didn’t you stand up and say, “No, you’re all wrong. Peace is the way, not war. You need to realize the mistakes you’re making!”
My goal in this process has been to work through the system as much as possible and not to be obnoxious about it. This is my testimony, and I’m giving it to the Navy, and the Navy is going to make their decision on it, and I’m going to follow the Navy’s rules to the best of my ability about this decision. I will refuse orders to kill people, but to the best of my ability I’m going to follow the rules.
One of those rules was when my chain of command “highly recommended” I not talk to anyone else about this. I don’t think they were worried about the officers, but that if the enlisted guys found out. I don’t want to cause a scene, and I don’t want to get charged with conduct unbecoming or spreading dissent or treason or anything.
I remember a story my last captain told us over lunch once. He was talking about when he was a junior officer on his first submarine. One of the other officers really sucked at his job. He was constantly breaking equipment and making more work for the others. One day, the guy had a nervous breakdown and said he couldn’t take it anymore and was kicked out of the submarine force. Everyone called him a coward and a pacifist. Not a pacifist because he didn’t believe in war, but pacifist was an insult. It was a way to mock him and call him stupid.
We’ll I’m a pacifist, and I’m not stupid. I’m actually pretty good at running a nuclear plant. I’m the one picking up others’ slack. I’m always given top rankings in my reviews, and a couple of honors. I figure that since this work isn’t directly killing someone, I can do it for the time being, and if I’m going to do it, I’m going to do it better than anyone else. This is my way of turning the other cheek. The Navy’s asked for my tunic, and I’m giving you my cloak as well. I’m going the second mile for you, sir.
Maybe one day all these guys I work with will find out about this, and my actions will bring Jesus glory. But I don’t know for sure. Maybe I could be doing things better. I’m just trying to do my best to honor God in a really difficult situation here. It kinda sucks.
I talked to your father yesterday about why you can’t stay in the military and do something that’s of a different nature that doesn’t involve warfare. I think he had said that in his discussions with you there was some remark about just wearing the uniform, you know. People seeing you wearing the uniform would indicate your support for the military, and that would be unacceptable to you. Was that statement correct?
Yes sir, every day. Even though I’m not currently in a combat position, it weighs against my beliefs. Everything I have to do at work contributes to warfare, it makes others more effective killers, and that’s not compatible with my beliefs. That’s why I need a discharge.
My parents and I talked a lot about noncombatant roles I might be able to take. I think they were very worried for me. They knew I couldn’t continue as I was, but thought that getting a discharge just wasn’t the way out. So we spent a lot of time looking at other possibilities. Like I said, I didn’t want a discharge and tried really hard to find any solution that would solve my beliefs without a discharge. I think this is one of the reasons it took me so long to fill out that first application too.
Basically I made a list of all the possible noncombatant jobs in the navy. There’s a manual somewhere that has them all listed. I went down the list of these billets and asked myself, “Is there anyway I could live with myself if I did this job for the next four years.” And the answer was always no. Even the people on hospital ships are being sent to foreign countries to “project American sea power” and provide future bases of military operation.
I remember when I was a little kid. I would see marines coming home from the Gulf War, and I was so proud of them! I wanted to be just like them when I grew up! I think that probably was a huge influence for why I joined the navy in the first place. But I don’t want kids looking at me like that. When people look at me, I want them to see a disciple of Jesus, not Washington.
In your letter to Naval Personnel Command dated 24 Nov 2009, you stated “I continue to respect those in the military for their sacrifices in support of our country.” How is it that you have respect for people that do something that you don’t believe in?
Well, I have respect for people because of their values. It’s the values that I see in service members that attracted me originally—of self sacrifice, honor, courage, and commitment—which have been important to me, are important to me, and will continue to be. I think honoring these values with nonviolence is the higher calling, but I still have many friends whom I respect who disagree. So I feel that I cannot be in military, but I don’t want to insult people who disagree with me. I don’t want to insult people who are still trying to think like Bonhoeffer, people who are trying to make our wars more just.


](http://www.reddit.com/r/Sidehugs/comments/14uqyz/your_namer98_macro_is_here/)


 Here’s the stuff that we can also use for food:


 In both the above cases, the distribution is centered around 0.5 because


 Garfield is very similar to himself, that’s why Box A gives him a low score–nearly zero. Odie is not very similar to Garfield, but he’s a lot closer than a palm tree. The specific numbers outputted don’t matter. All that matters is the ordering created by those numbers. In this case:
 Of course, if we compare against a different image, we will probably get a different ordering.
 Notice that Box A thinks the real cat is more similar to Garfield than Odie is. Now let’s consider another black box. Imagine Box B is designed to see if two images were drawn in a similar style. Box B might give the following:


